(English version below)
Ciao,
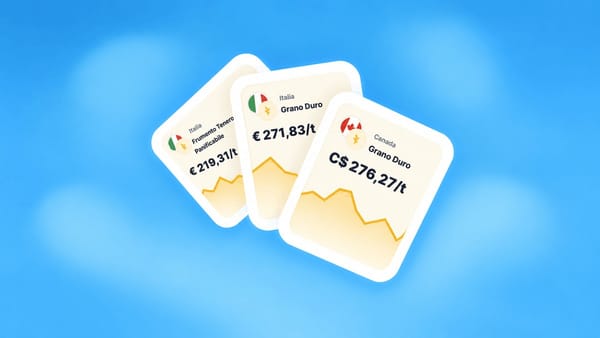
Da questa settimana MercatiGrano pubblica una nuova sezione dedicata al Trade Agroalimentare UE.
I dati doganali TAXUD della Commissione Europea, finora accessibili solo attraverso portali tecnici difficili da leggere, diventano una dashboard operativa aggiornata ogni settimana, pensata per chi lavora ogni giorno con i mercati cerealicoli.
Cosa trovi nella sezione Trade?
Monitoriamo dieci commodity: frumento duro, frumento tenero, mais, orzo, avena, segale, soia, colza, girasole, riso con due livelli di lettura: una pagina principale /trade/ per una visione d'insieme, ed una pagina dedicata per ogni commodity.
La nostra offerta iniziale è come da tabella qui sotto, ci riserviamo il diritto di modificare alcune funzionalità fra le gratuite e a pagamento nelle prossime settimane.
Pagina principale /trade/
| Funzionalità | Gratuito | Abbonato |
|---|---|---|
| Tabella riepilogativa (tutte le commodity, vol. YTD, vs media) | ✓ | ✓ |
| Capital Rotation chart (import per settore + export totale) | ✓ | ✓ |
| Country Snapshot — KPI cards (top commodity, quota EU%, trend 8w) | ✓ | ✓ |
| Country Snapshot — Tabella commodity (vol YTD, quota EU%, trend, Z-score) | ✓ | ✓ |
| Country Snapshot — Grafico storico (linea totale) | ✓ | ✓ |
| Origini import per commodity (ultimi 3 mesi / 13 settimane) | ✓ | ✓ |
| Origini import — storico esteso 1/2/5 anni | — | ✓ |
| Country Snapshot — Grafico evoluto (stacked bar per stato membro UE) | — | ✓ |
| Country Snapshot — Tabella "Chi acquista nell'UE" (distribuzione per stato membro) | — | ✓ |
Pagine commodity (esempio /trade-grano-duro/)
| Funzionalità | Gratuito | Abbonato |
|---|---|---|
| KPI: Vol. importato settimana corrente, WoW % | ✓ | ✓ |
| KPI: Vol. YTD corrente | ✓ | ✓ |
| Grafico Unit Value €/kg nel tempo (CIF medio ponderato, fino a 7 anni) | ✓ | ✓ |
| Grafico Import per origine (stacked bar, fino a 7 anni) | ✓ | ✓ |
| KPI: YTD vs media 5 anni | — | ✓ |
| KPI: Z-Score 52w | — | ✓ |
| KPI: Segnale offerta (badge) | — | ✓ |
| Grafico Premio/sconto CIF per origine vs media UE (€/t) | — | ✓ |
| Grafico Export per destinazione (stacked bar) | — | ✓ |
| Grafico Z-Score rolling 52 settimane | — | ✓ |
| Grafico Stagionalità (range min/max + media storica) | — | ✓ |
| Tabella distribuzione per stato membro UE importatore (+ grafico click-through) | — | ✓ |
| Tabella raw data settimanale | — | ✓ |
Inizia da qui oggi: mercatigrano.it/trade
È una sezione nuova e stiamo ancora affinando questo prodotto. Se hai commenti, suggerimenti o qualcosa che non funziona come dovrebbe, rispondi direttamente a questa email, la leggeremo con attenzione.
Buon lavoro,
Michele Peroni
Hello,
Starting this week, MercatiGrano is launching a new section dedicated to EU agri-food trade.
The European Commission’s TAXUD customs data, previously accessible only through technical portals that were difficult to read, is now presented as a weekly updated operational dashboard, designed for those who work with the grain markets on a daily basis.
What can you find in the Trade section?
We track ten commodities: durum wheat, soft wheat, corn, barley, oats, rye, soybeans, rapeseed, sunflower seeds, and rice, with two levels of information: a main page /trade/ for an overview, and a dedicated page for each commodity.
Our initial offering is as below, we reserve the right to modify some functionalities between free and paid in the coming weeks.
Main page /trade/
| Feature | Free | Subscriber |
|---|---|---|
| Summary table (all commodities, YTD vol., vs average) | ✓ | ✓ |
| Capital Rotation chart (import by sector + total export) | ✓ | ✓ |
| Country Snapshot — KPI cards (top commodity, EU% share, 8w trend) | ✓ | ✓ |
| Country Snapshot — Commodity table (YTD vol., EU% share, trend, Z-score) | ✓ | ✓ |
| Country Snapshot — Historical chart (total line) | ✓ | ✓ |
| Import origins by commodity (last 3 months / 13 weeks) | ✓ | ✓ |
| Import origins — extended history 1/2/5 years | — | ✓ |
| Country Snapshot — Advanced chart (stacked bar by EU member state) | — | ✓ |
| Country Snapshot — "Who buys in the EU" table (distribution by member state) | — | ✓ |
Commodity pages (example /trade-grano-duro/)
| Feature | Free | Subscriber |
|---|---|---|
| KPI: Current week import volume, WoW % | ✓ | ✓ |
| KPI: Current YTD volume | ✓ | ✓ |
| Unit Value €/kg chart (weighted CIF average, up to 7 years) | ✓ | ✓ |
| Import by origin chart (stacked bar, up to 7 years) | ✓ | ✓ |
| KPI: YTD vs 5-year average | — | ✓ |
| KPI: 52-week Z-Score | — | ✓ |
| KPI: Supply signal (badge) | — | ✓ |
| CIF premium/discount by origin vs EU average (€/t) chart | — | ✓ |
| Export by destination chart (stacked bar) | — | ✓ |
| Rolling 52-week Z-Score chart | — | ✓ |
| Seasonality chart (min/max range + historical average) | — | ✓ |
| Distribution table by EU importing member state (+ click-through chart) | — | ✓ |
| Weekly raw data table | — | ✓ |
Get started here today: mercatigrano.it/trade
This is a new section, and we are still refining this product. If you have comments, suggestions, or notice something that isn’t working as it should, please reply directly to this email; we will read it carefully.